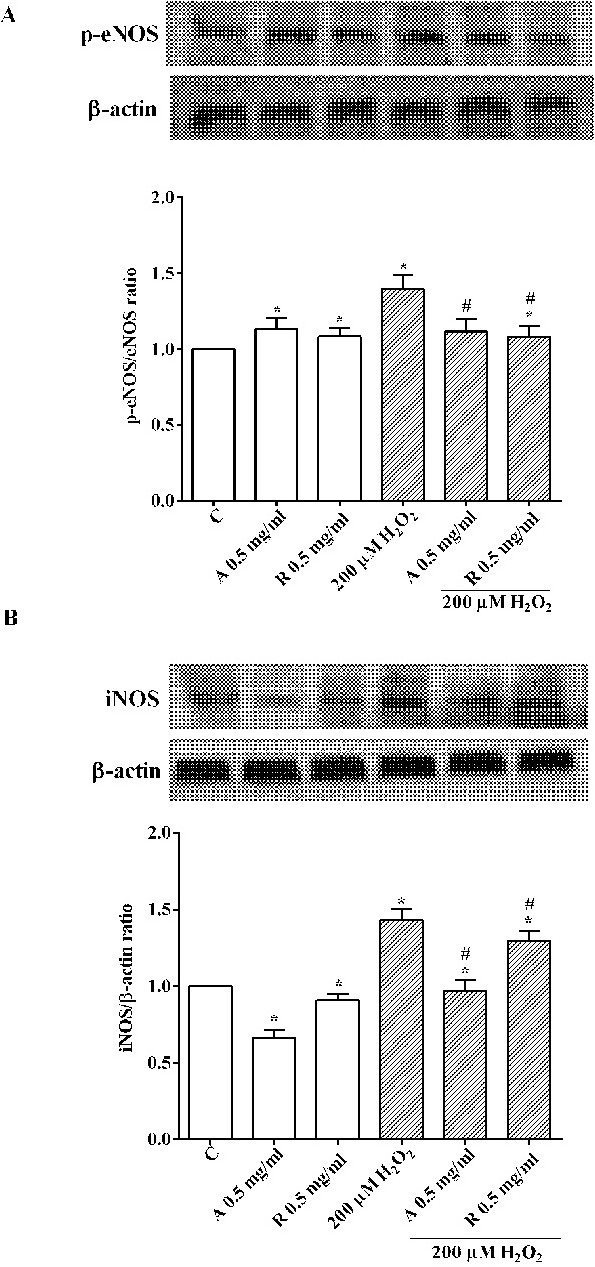
Fig. 4. Variation in eNOS phosphorylation and iNOS expression measured in RPE cells by Western blot and densitometric analysis. In A and B, densitometric analysis and an example of Western blot of p-eNOS and iNOS are respectively shown. Abbreviations are as in previous Fig.s. The data were normalized versus control cells. Reported data are means ± SD of five independent experiments for each experimental protocol. Significance between groups: *P<0.05 vs C; #P<0.05 vs 200 μM H2O2.